
Application Performance Monitoring: How to Detect Problems Before Customers Do
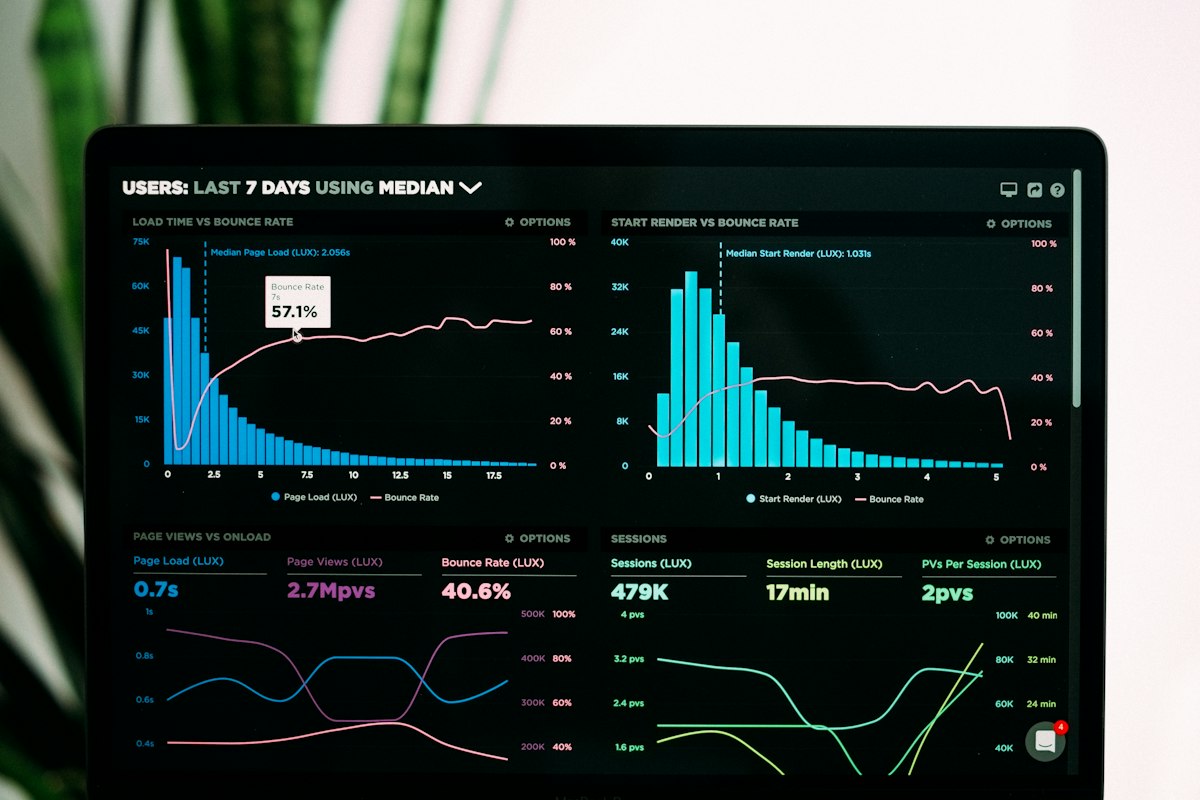
Application performance monitoring (APM) is the practice of continuously measuring how your software behaves in production, using logs, metrics, traces, and error tracking, so you detect and resolve problems before customers notice them. It shifts a team from reacting to complaints to preventing them.
Too many businesses learn their website is down from an angry customer, a missed sale, or a social media post. By then the damage is done: revenue lost, trust dented, and a team scrambling without clear information.
Monitoring and observability change that story. This guide explains the building blocks and how to set up a practical program for a business application.
What Is the Difference Between Monitoring and Observability?
Monitoring tells you when something is wrong, usually through predefined checks such as server health or response time. Observability goes further by giving you enough data to understand why it is wrong, even for problems you did not anticipate. In practice you want both: monitoring to raise the alarm, observability to find the cause quickly.
What Are Logs, Metrics, and Traces?
These three signals are the foundation of observability, and each answers a different question.
Logs: What Happened?
Logs are time-stamped records of events, such as a failed login or a payment error. Structured logs in a consistent format are far easier to search than free text, and centralizing them in one place avoids hunting across servers.
Metrics: How Is It Performing?
Metrics are numerical measurements over time, such as response time, error rate, requests per second, CPU, memory, and queue length. They are ideal for dashboards, trends, and alerts.
Traces: Where Is the Time Going?
Traces follow a single request across services, databases, and external APIs, showing which step is slow. They are especially valuable in systems with multiple components or third-party integrations.
Why Is Error Tracking Essential?
Error tracking captures exceptions in both backend and frontend code, groups similar errors, and shows stack traces, affected users, and the release that introduced them. It reveals problems that never produce an obvious outage, such as a checkout button failing for one browser. Linking errors to deployments helps teams roll back or patch quickly.
What Should You Monitor From the User's Perspective?
Server health does not guarantee a good experience. Add uptime checks from multiple locations, synthetic tests that simulate key journeys such as login, search, and checkout, and real user monitoring that measures actual page speed and Core Web Vitals on customers' devices. These show what users genuinely experience, including slow networks and regional issues.
- Availability and response time of critical pages and APIs.
- Error rates on key business actions such as payments and sign-ups.
- Page load and interaction metrics on mobile and desktop.
- Third-party dependencies such as payment gateways and email services.
- Database performance, including slow queries and connection limits.
How Do You Design Alerts That Help Instead of Annoy?
Alert fatigue is real: when everything triggers a notification, people stop paying attention. Alert on symptoms that affect users, such as high error rate or slow checkout, rather than every minor technical blip. Set clear thresholds, route alerts to the right people, include context and runbook links, and review noisy alerts regularly.
What Is an Incident Response Process?
A simple, rehearsed process: acknowledge the alert, assess impact, communicate status, fix or roll back, and then hold a blameless review to prevent recurrence. Even small teams benefit from defining who is on call and how customers are informed.
How Does Monitoring Support Business Goals?
Monitoring is not only technical hygiene. It protects revenue by shortening outages, supports service-level commitments to customers, guides capacity planning before traffic peaks such as sales seasons, and provides evidence for prioritizing performance work. Tying technical metrics to business outcomes, for example checkout success rate, makes the value visible to non-technical leaders.
What Does a Monitoring Setup Cost?
A foundational setup with uptime checks, error tracking, and basic dashboards and alerts commonly ranges from AED 6,000 to AED 25,000. A comprehensive observability implementation with centralized logging, distributed tracing, custom business dashboards, and on-call workflows may range from AED 30,000 to AED 120,000, plus ongoing tool subscription costs.
At The Codx, we build monitoring into the applications we deliver, with error tracking, performance dashboards, and meaningful alerts, so your team hears about problems from the system first and not from your customers.
Frequently Asked Questions
What is application performance monitoring?
Continuously measuring an application's health and performance in production to find and fix issues early.
What is the difference between logs, metrics, and traces?
Logs record events, metrics measure performance over time, and traces follow requests across components.
Why is error tracking important?
It captures hidden failures, groups them, and links them to releases and affected users.
What is observability?
The ability to understand why a system behaves as it does using the data it emits.
Do small businesses need monitoring?
Yes. Even basic uptime and error alerts can prevent costly unnoticed outages.
What is synthetic monitoring?
Automated tests that simulate user journeys to detect problems proactively.
How do I avoid alert fatigue?
Alert on user-impacting symptoms, tune thresholds, and remove noisy alerts.
How much does monitoring cost?
Often AED 6,000 to AED 25,000 for basics and AED 30,000 to AED 120,000 for full observability.
Can monitoring help with performance and SEO?
Yes. Real user monitoring of Core Web Vitals highlights speed issues affecting experience and search performance.
How does The Codx approach monitoring?
We include error tracking, dashboards, and actionable alerts in the applications we build.